The Polynesians, scattered as they were over 1,000 islands across the central and southern Pacific Ocean, were master navigators who tracked their way over a huge expanses of ocean without any of the complex mechanical aids we associate with sea fairing. They didn’t have the astrolabe or the sextant, the compass or the chronometer. They did however have aids of a sort, which though seemingly humble, were in fact the repositories of an extremely complex kind of knowledge. Called Rebbelibs, Medos. and Mattangs, today we call them simply “Stick Charts.”
There are three kinds of stick charts.
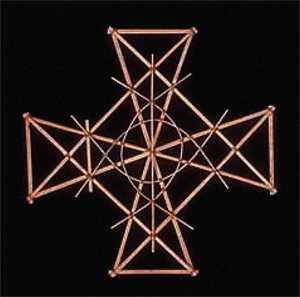
The “MATTANG” or “WAPPEPE” is a small, square shaped chart which shows wave patterns around a single island or atoll and was used for teaching purposes only.
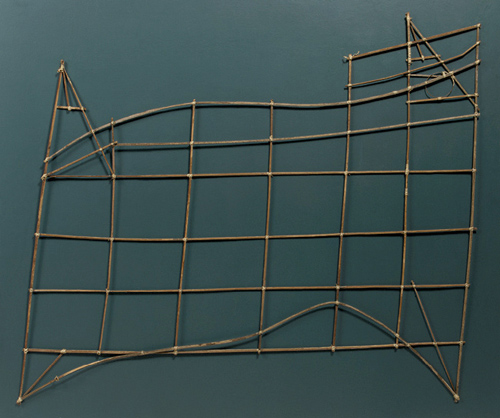
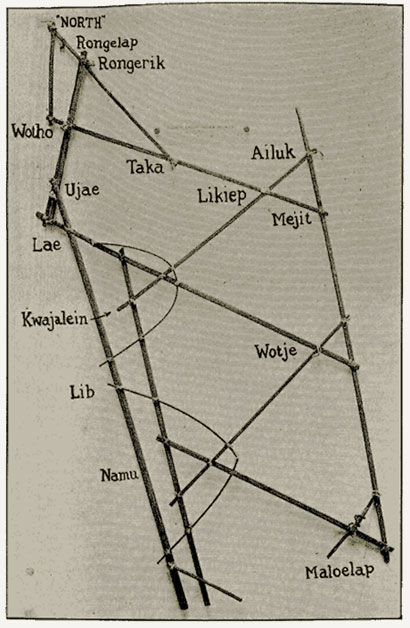
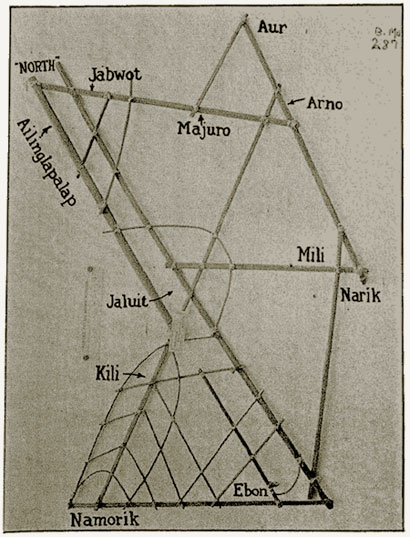
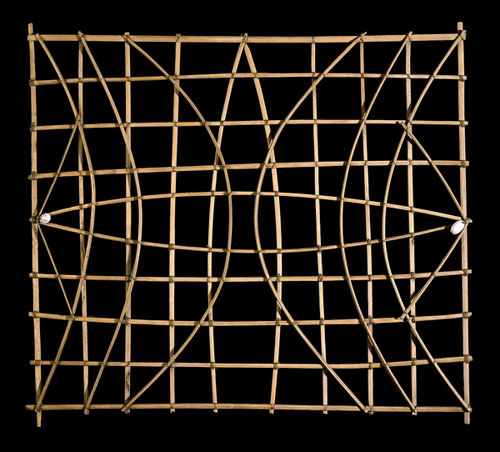
The “REBBELIB” is a general wave navigational chart mapping an entire chain, showing the relationships between the islands and the major ocean swells.

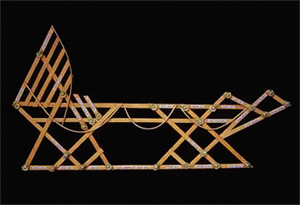
The “MEDO” covers only a few islands and is useful for specific voyages.
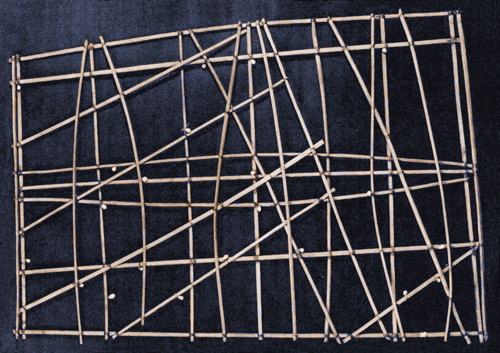
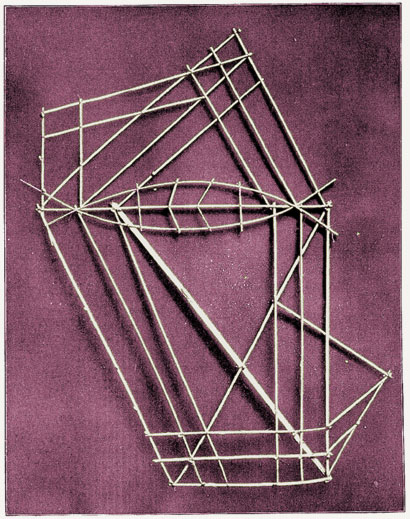
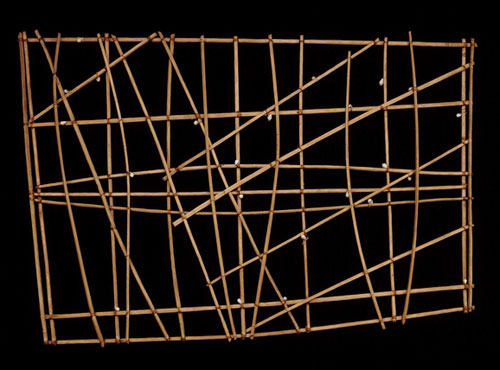
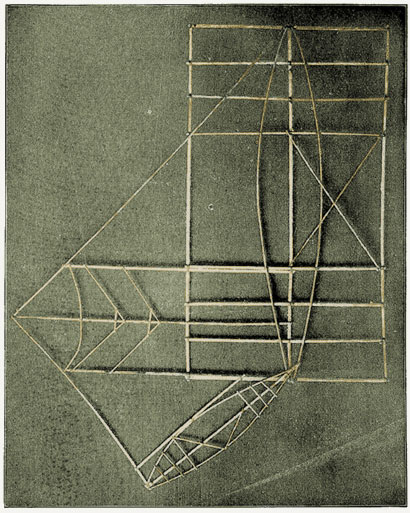
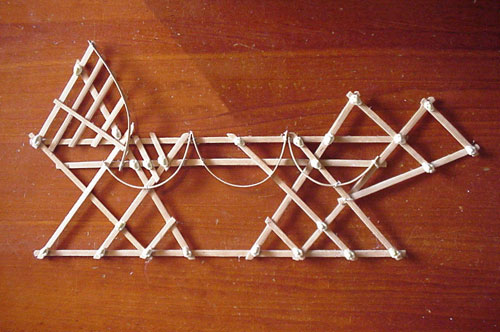
The charts were made by men from thin strips of coconut frond midribs or pandanus root. They were then bound together with coconut sennit in geometric patterns depicting sea currents around the low lying atolls. Small money cowrie shells or coral pebbles indicated islands and curved sticks represent wave patterns.
They were not carried on a voyage and the adult navigator gauged the wave patterns represented in the Stick Charts entirely by his sense of touch. “He would crouch in the bow of his canoe and literally feel every motion of the vessel.” As with ripples in a pond they “concentrated on refraction of swells as they came in contact with undersea slopes of islands and the bending of swells around islands as they interacted with swells coming from opposite directions.”
A fascinating aspect of the charts is that they varied so much in form and interpretation that they were “readable” only by the specific navigators who constructed them. Evidently the knowledge contained in each was a closely guarded secret.

Wikipedia says: “The stick charts are a significant contribution to the history of cartography because they represent a system of mapping ocean swells, which was never before accomplished. They also use different materials than is common in other parts of the world. They are an indication that ancient maps may have looked very different, and encoded different features from the earth, than the maps we use today.”

Use of stick charts and navigation by swells apparently came to demise after World War II, when travel between islands by canoe halted. They continue to be made in Polynesia, though very few people are able to use them as navigation aids. They are made and sold instead as tourist souvenirs.
For much more info see the following (images and text were adapted from these):
Wikipedia entry.
Reading Patterns in the Waves.
Ethnomathics Digital Library.
Digital Micronesia.
Micronesian Stick Charts.
Mariner’s Museum.
The Leek-Green Sea.
Stick Charts.
Visit Marshall Islands.com
THe British Museum.
The Met.
World Weather, Climate, and Society Projects.
And Lastly I’d like to recommend the following for some interesting context-
Varieties of Unreligious Experience.
Hope you enjoyed.

